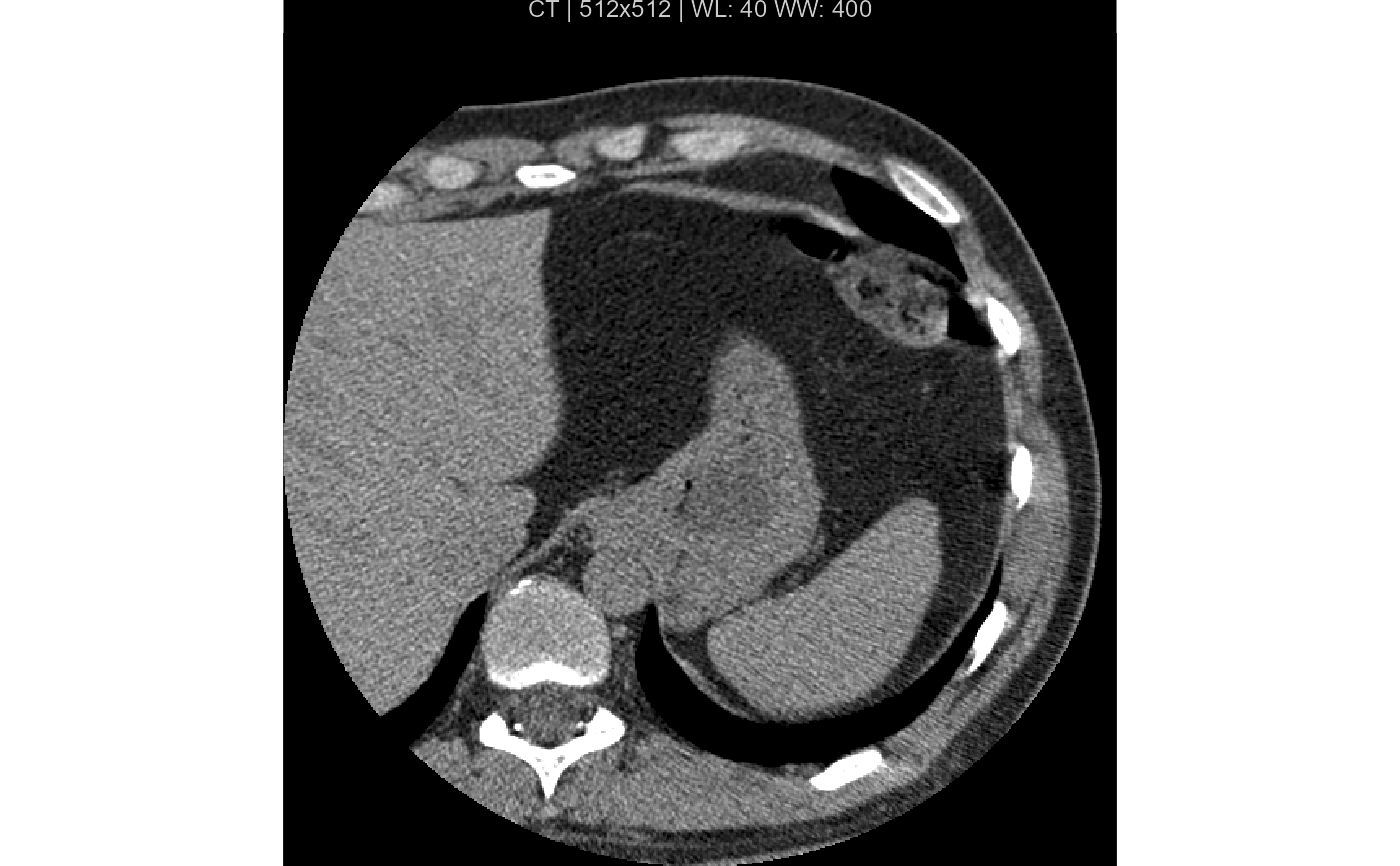
Renders a 2D slice of a DICOM image as a ggplot2::ggplot object with clinical window/level scaling, proper pixel aspect ratio, and optional radiological metadata overlay.
Usage
plot_dicom(
  x,
  frame = 1L,
  window = "auto",
  center = NULL,
  width = NULL,
  palette = c("gray", "viridis", "inferno", "magma", "plasma"),
  annotate = TRUE,
  title = NULL
)
Arguments
- x
Path to a DICOM file, a
"dicom_pixels"matrix/array, or a"dicom_series"object.- frame
Integer slice/frame index (1-based) when
xis multi-frame or a"dicom_series". Default is1L.- window
Window preset (
"auto","brain","lung","bone","abdomen", etc.) orc(center, width). Default is"auto".- center, width
Optional explicit window center and width.
- palette
Color palette:
"gray"(default radiological grayscale),"viridis","inferno","magma", or"plasma".- annotate
Logical. Display clinical overlay text (modality, dimensions, window center/width). Default is
TRUE.- title
Optional plot title.
Value
A ggplot2::ggplot object.
Examples
dcm_file <- system.file("extdata", "example.dcm", package = "dicomtk")
p <- plot_dicom(dcm_file)
p